How to use
1. Explore the universe
Drag to navigate. Use mouse wheel to zoom in and zoom out. (In 3D version, left-drag to rotate, right-drag to pan, and mouse wheel to zoom)
Our method assumes that all samples are mixtures of some "topics" (or "latent environment"), and that both the microbial community structure and the natural language descriptions of samples were stochastically generated based on topics. Each dot on the map represents a sample and pictures correspond to topics. Coordinates of samples were calculated by t-SNE based on the similarity of topic compositions among samples. Picturess are mapped to coordinates where the mixing percentage of the topic is 100%.
1.1 Click on a topic
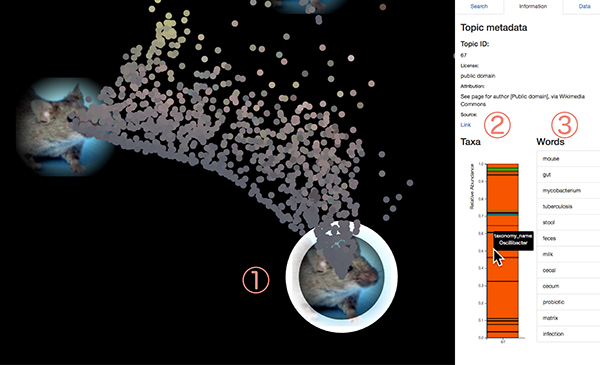
A picture represents a "topic". Microbial communities of samples (dots) around the topic are strongly affected by that topic. Click on one of the pictures (figure below, 1). Information on that topic will be displayed in the right panel. Each topic has observation probability of microbes (2) in microbial communities, and word generation probability (3) in sample description metadata. The bar graph of the observation probability of microbes displays their name during a mouse over (2). Words with high generation probabilities in this topic are also displayed (3).
1.2 Click on a sample
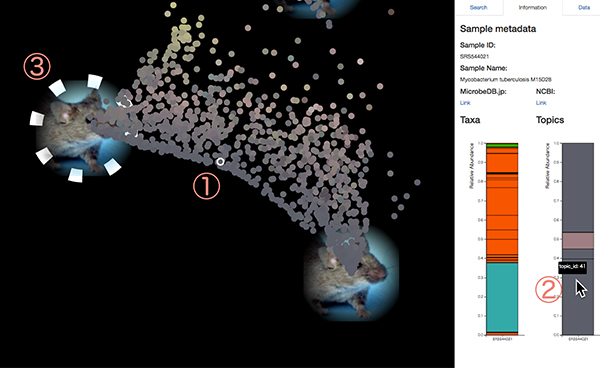
Dots represent samples of 16S rRNA gene amplicon sequencing projects. Click on one of the dots (1). On the right panel, taxonomic composition of the sample analyzed by VITCOMIC2 is displayed as a bar graph. Also, topic composition of that sample inferred by LEA is displayed on the panel (2). When you mouse over the topic's bar graph, the pictures of corresponding topic will be highlighted on the map (3).
2. Search samples
It is possible to search samples using natural language as a search query, like "forest soil", "hot spring", etc. Instead of searching samples by exact matching between the sample description metadata and the words contained in the query, samples related to the query over topics can be extracted, using the probability of each sample to generate the query sentence as the score of the sample.
2.1 Search and highlight
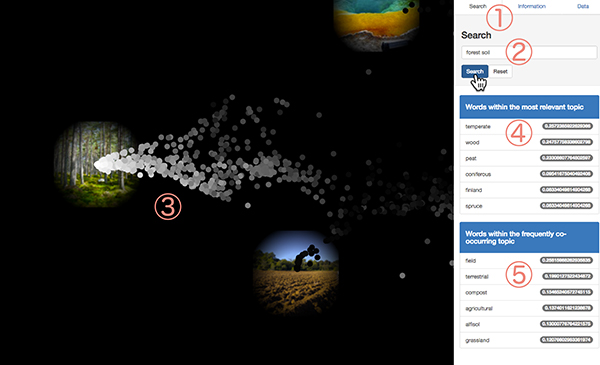
First, click Search tab on the right side panel (1). Enter English sentences or some English words in the box (2). NOTE: The order of words is ignored and negation (e.g. "Not soil") can not be handled. Then, Click the search button or press the enter key.
Samples with high generation probabilities of words included in the search query (samples in which those words are likely to appear in the sample description metadata) will be highlighted on the map according to their probability values (3).
Search results can be cleared by clicking the reset button.
2.2 Search suggest
When you click the search button, words related to the search query you entered will be displayed in the right panel (figure above, 4, 5). When you click a suggested word, the word is added to the search box and you can search further.
The upper panel (4) shows words "semantically related" to the search query. Those words are semantically similar to queries ("marine" is similar to "ocean"), or are frequently combined with queries in sample description metadata ("pacific" often combines with "ocean"). Those words are retrieved by identifying the topic which have the highest generation probability of the search query and listing high probability words in that topic.
The lower panel (5) shows words "ecologically related" to the search query. Those words are in the topic which are frequently co-occurred with the "semantically related" topic among samples. In other words, although the meanings of those words are not similar to the search query, those were often co-occurred with the query in environmental description of microbial community samples ("sediment" often co-occur with the "ocean, marine, pacific" topic).
2.3 Search with names of taxa in any taxonomic level
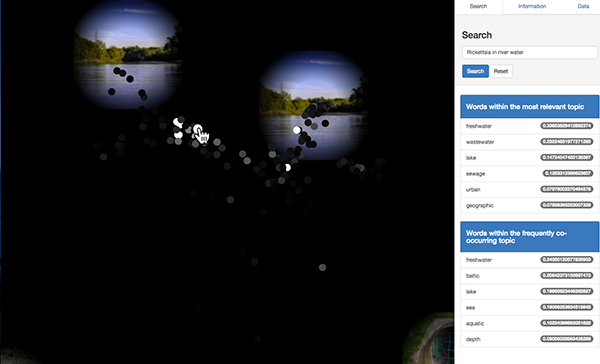
Bacterial or archaeal taxonomy names can be included in the search query. For example, "Gemmatimonadetes in ocean", "Gammaproteobacteria on the toilet seat", etc. The score of each sample is rescaled by the relative abundance of the taxa included in the query.
The figure below is the result of searching for "Rickettsia in river water". The top score sample is derived from a lake in which Rickettsia exists abundantly, and it matches the search query in terms of "Rickettsia inhabiting a freshwater environment". This sample does not include words "river" or "water" in its metadata, so it can not be acquired with a simple string matching search method. In our system, such fuzzy search of samples can be possible by evaluating semantically only for the partial query "river water" and evaluating the actual abundance for the taxonomy name in the query.
3. Global positioning of your data
Our system can predict latent environmental topics of new samples using a Bayesian prediction method. Because the function for dimension reduction of t-SNE were trained using a neural network procedure, it is possible to arrange the locations of new samples on the global map according to the topic compositions without changing the coordinates of existing samples. Thus this system can be regarded as the microbial version of Global Positioning System.
3.1 Place a single sample on the map
Taxonomic compositions for the sequence data (fasta or fastq files) of your sample shoule be analyzed by a VITCOMIC2 server.
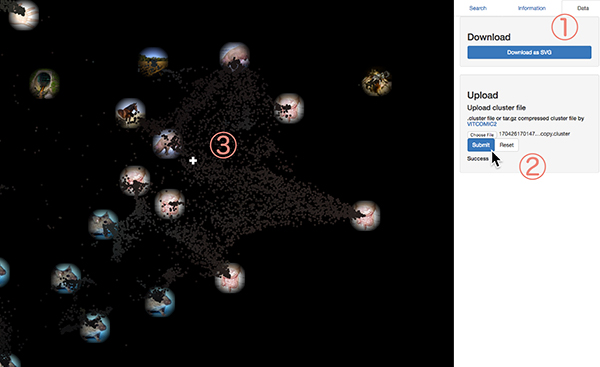
You can find the file named your_sample_id.clast_nocopy.cluster.gz in result files received from the VITCOMIC2 server. This file is the gzip compressed file for the taxonomic composition data of your sample. First, unzip the file. Then, click Data tab on the right side panel (figure below, 1). Click the Choose File button (2), select the unzipped file, and press the Submit button. Calculation takes several seconds. After the calculation, global map will be automatically updated. The color of the existing sample will be darker and your sample will be displayed as a cross marker on the map (3). Cliking the cross, you will also get taxonomic composition and topic composition data of your sample. When you click the link at the "Project ID", you can download the csv file of topic compositions of your data. Results can be cleared by clicking the Reset button.
3.2 Place multiple samples on the map
Multiple samples can be mapped simultaneously. To upload multiple samples, please put each VITCOMIC2-cluster file (NOTE: each cluster file should be unzipped) in a directory and make gzip compressed tar archive (.tar.gz file). Then, upload .tar.gz file and press Submit.
Calculation time depends on the number of samples. Processing 300 samples takes about 1 minute.
As an example of multiple sample mapping, the mapping result for the data set of Halfvarson, et al. 2017 is shown below.
In their study, dynamics of gut microbiome of healthy people and inflammatory bowel disease (IBD) patients are compared. They found that, although the gut microbiome of healthy people fluctuate over time, the fluctuation range is confined to the "healthy plane" (HP) they defined, while the gut microbiome of IBD patients deviates frequently from HP.
We downloaded sequence data of their study (PRJEB18471), analyzed those data by VITCOMIC2, and uploaded the result files on the LEA global map.
The figure below shows the mapping result of the time series gut microbiome of healthy controls.
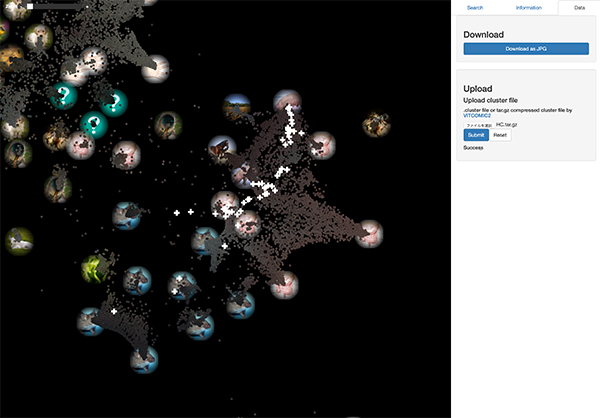
This result coincides with their study. Most of samples of healthy controls are confined within "Gut area" on the LEA global map. This is because many of gut microbiome samples used for machine learning of our system are derived from healthy subjects of previous studies.
On the other hand, the figure below shows the mapping result of the time series gut microbiome of ulcerative colitis (UC) patients. Compared to the dynamics of healthy controls, it can be seen that gut microbiome of UC patients tend to scatter in a wider range.
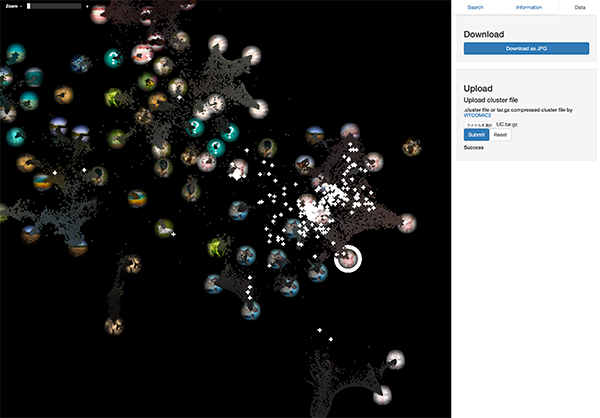
These results reproduce the work of Halfvarson, et al. 2017. Once you got a taxonomic composition analysis result by VITCOMIC2, such sample evaluation is possible in a few seconds on the LEA global map.
Dataset used in this section can be downloaded: a single file, multiple samples of healthy controls, multiple samples of ulcerative colitis patients.
NOTE: new sample data on our server will be erased 24 hours after the uploading, and will be inaccessible.
4. Data availability
All data used in the LEA global map are available via REST API.
5. Reference
Koichi Higashi, Shinya Suzuki, Shin Kurosawa, Hiroshi Mori, Ken Kurokawa (2018) Latent environment allocation of microbial community data. PLoS Comput Biol 14(6): e1006143. https://doi.org/10.1371/journal.pcbi.1006143